Examples: examples/tickstyles.py
Back to Examples
1 2 3 4 5 6 7 8 9 10 11 12 13 14 15 16 17 18 19 20 21 22 23 24 25 26 27 28 29 30 31 32 33 34 35 36 37 38 39 40 41 42 43 44 45 46 47 48 49 | plot = Plot()
line = Line()
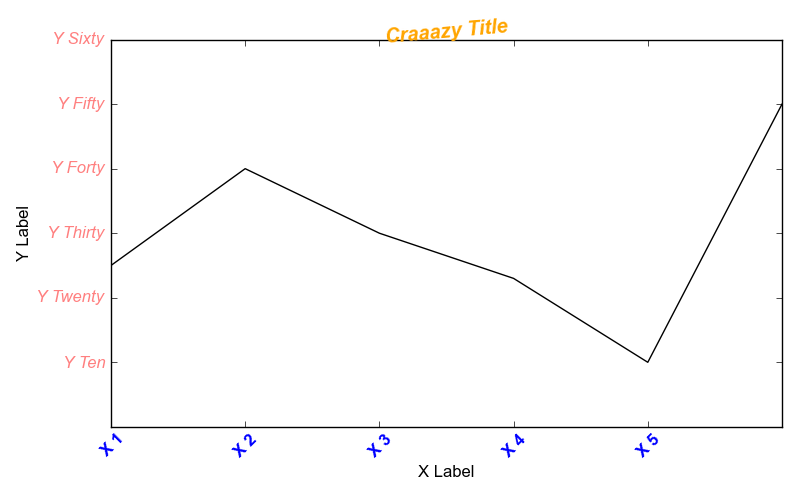
line.yValues = [25, 40, 30, 23, 10, 50]
line.xValues = range(len(line.yValues))
line.xTickLabels = ["X 1", "X 2", "X 3", "X 4", "X 5"]
line.yTickLabels = ["Y Ten", "Y Twenty", "Y Thirty", "Y Forty",
"Y Fifty", "Y Sixty"]
line.yTickLabelPoints = [10, 20, 30, 40, 50, 60]
# You can set tick label properties with a dictionary ...
line.xTickLabelProperties = {
"color" : "blue",
"weight" : "bold",
"rotation" : 45
}
line.yTickLabelProperties = {
"style" : "italic",
"alpha" : 0.5,
"color" : "red"
}
# (clearing for demonstrative purposes)
line.xTickLabelProperties.clear()
line.yTickLabelProperties.clear()
# You can also set by direct elementwise access
line.xTickLabelProperties["color"] = "blue"
line.xTickLabelProperties["weight"] = "bold"
line.xTickLabelProperties["rotation"] = "45"
line.yTickLabelProperties["style"] = "italic"
line.yTickLabelProperties["alpha"] = 0.5
line.yTickLabelProperties["color"] = "red"
plot.add(line)
plot.title = "Craaazy Title"
plot.setTitleProperties(
style="italic", weight="bold", rotation="5",
color="orange")
plot.xLabel = "X Label"
plot.yLabel = "Y Label"
plot.yLimits = (0, 60)
plot.tight = True
plot.save(self.imageName)
|