Enter search terms or a module, class or function name.
Back to Examples
 1
 2
 3
 4
 5
 6
 7
 8
 9
10
11
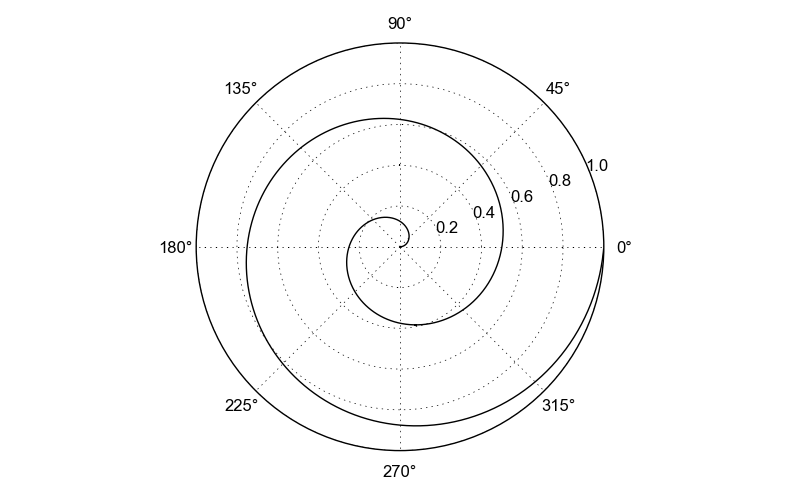
plot = Plot()
plot.projection = 'polar'

r = arange(0,1,0.001)
theta = 2*2*pi*r

line = Line()
line.xValues = theta
line.yValues = r
plot.add(line)
plot.save("projection.png")