Examples: examples/layout.py
Back to Examples
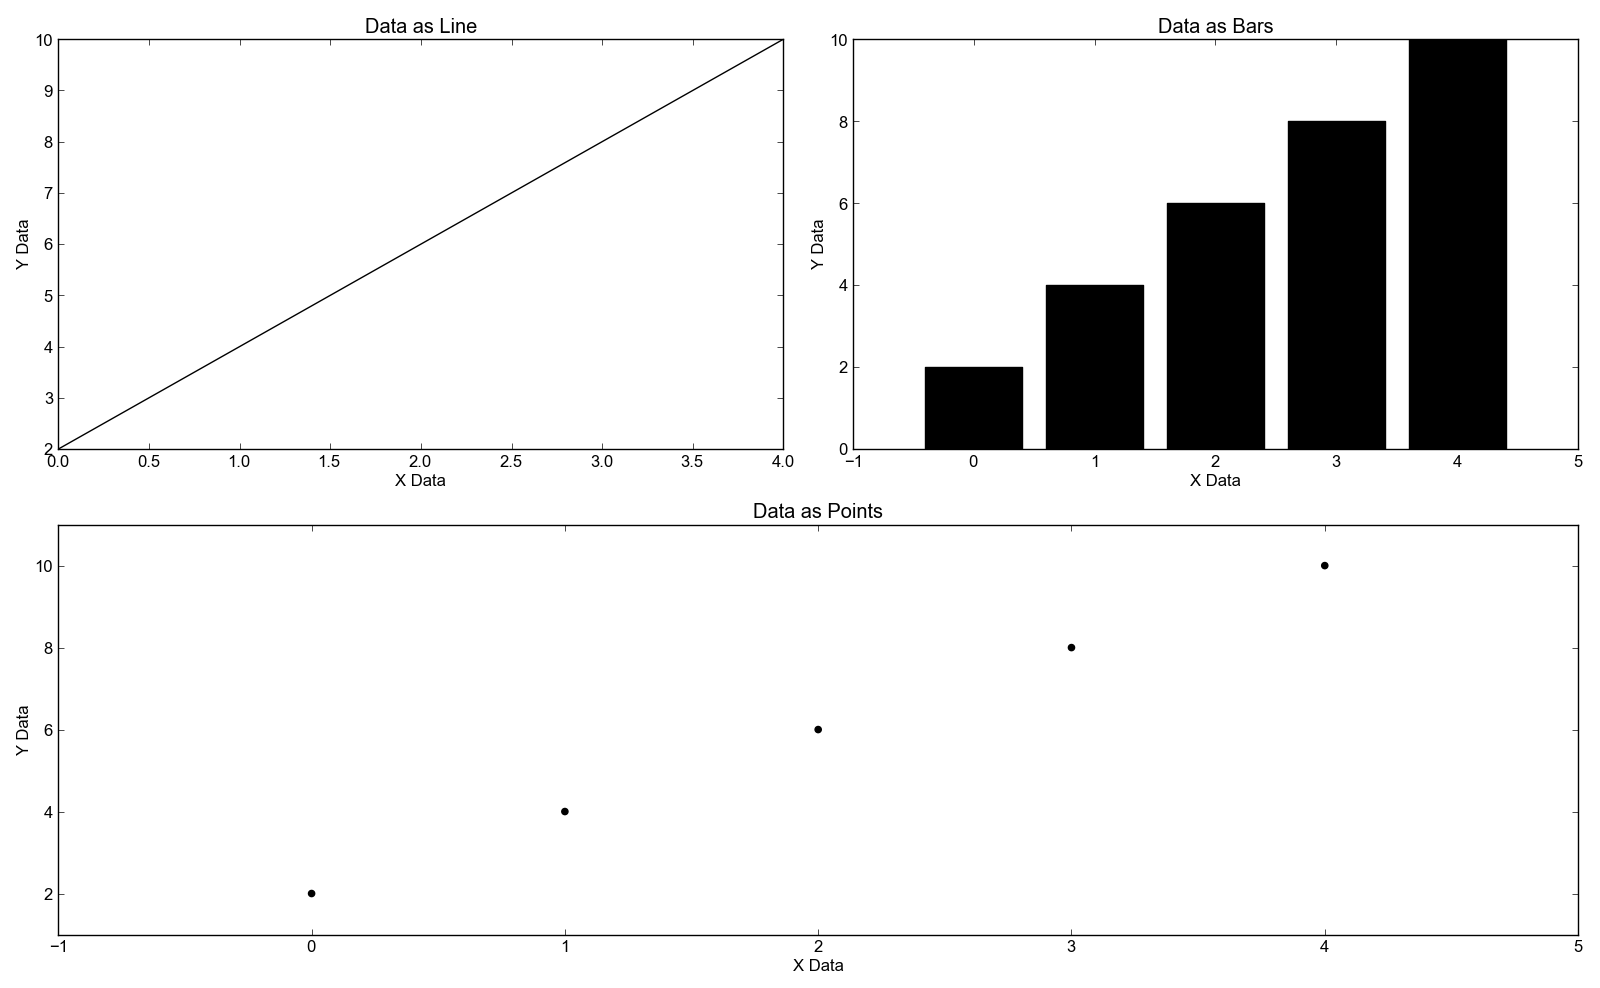
1 2 3 4 5 6 7 8 9 10 11 12 13 14 15 16 17 18 19 20 21 22 23 24 25 26 27 28 29 30 31 32 33 34 35 36 37 38 39 | line = Line()
line.xValues = range(5)
line.yValues = [2, 4, 6, 8, 10]
linePlot = Plot()
linePlot.add(line)
linePlot.xLabel = "X Data"
linePlot.yLabel = "Y Data"
linePlot.title = "Data as Line"
bar = Bar()
bar.xValues = range(5)
bar.yValues = [2, 4, 6, 8, 10]
barPlot = Plot()
barPlot.add(bar)
barPlot.xLabel = "X Data"
barPlot.yLabel = "Y Data"
barPlot.title = "Data as Bars"
scatter = Scatter()
scatter.xValues = range(5)
scatter.yValues = [2, 4, 6, 8, 10]
scatterPlot = Plot()
scatterPlot.add(scatter)
scatterPlot.xLabel = "X Data"
scatterPlot.yLabel = "Y Data"
scatterPlot.title = "Data as Points"
layout = PlotLayout()
layout.addPlot(linePlot, grouping="topRow")
layout.addPlot(barPlot, grouping="topRow")
layout.addPlot(scatterPlot)
layout.save("layout.png")
|