Examples: examples/vline.py
Back to Examples
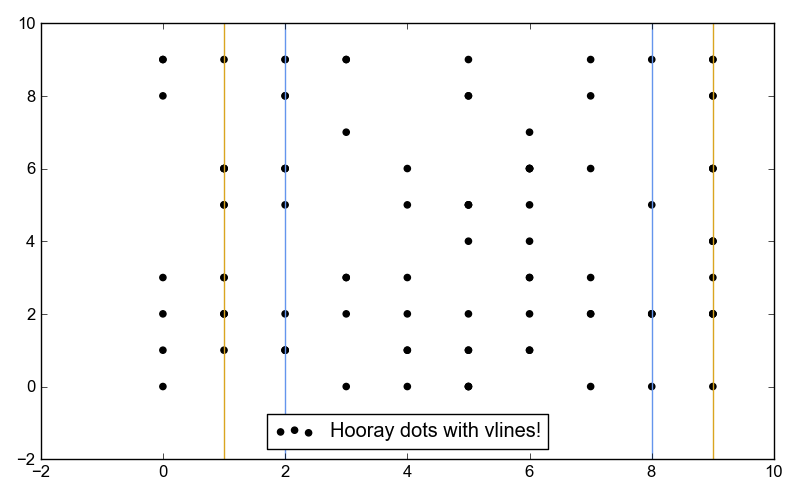
1 2 3 4 5 6 7 8 9 10 11 12 13 14 15 16 17 18 19 20 21 22 23 24 25 26 27 28 29 30 31 32 | scatter = Scatter()
scatter.label="Hooray dots with vlines!"
scatter.xValues = [
7, 6, 3, 5, 7, 6, 1, 1, 6, 5, 8, 6, 7, 8, 0, 2, 9, 3, 9,
5, 4, 5, 0, 0, 2, 3, 1, 4, 1, 3, 3, 8, 1, 5, 2, 6, 0, 3,
5, 1, 4, 9, 5, 1, 9, 9, 9, 7, 6, 5, 8, 6, 0, 2, 6, 9, 2,
5, 6, 9, 7, 8, 7, 6, 5, 9, 9, 2, 4, 9, 0, 1, 1, 1, 6, 4,
5, 8, 9, 1, 2, 1, 4, 5, 9, 7, 4, 9, 2, 9, 2, 5, 2, 2, 0,
2, 1, 9, 3, 6]
scatter.yValues = [
2, 5, 9, 5, 9, 3, 6, 1, 6, 0, 0, 6, 2, 5, 3, 9, 2, 7, 6,
2, 3, 1, 9, 9, 5, 2, 9, 0, 2, 3, 0, 2, 5, 5, 8, 4, 1, 9,
8, 6, 1, 6, 9, 2, 4, 9, 2, 8, 1, 1, 2, 1, 0, 6, 3, 4, 2,
5, 6, 8, 6, 9, 0, 6, 8, 6, 8, 1, 6, 2, 2, 3, 6, 2, 2, 2,
0, 2, 4, 6, 8, 5, 1, 4, 2, 3, 5, 3, 1, 0, 6, 0, 1, 6, 8,
9, 3, 9, 3, 7]
vline1 = VLine()
vline1.xValues = [2,8]
vline1.color = 'CornflowerBlue'
vline2 = VLine()
vline2.xValues = [1,9]
vline2.color = 'GoldenRod'
plot = Plot()
plot.hasLegend()
plot.add(scatter)
plot.add(vline1)
plot.add(vline2)
plot.save("vline.png")
|