Examples: examples/twinx.py
Back to Examples
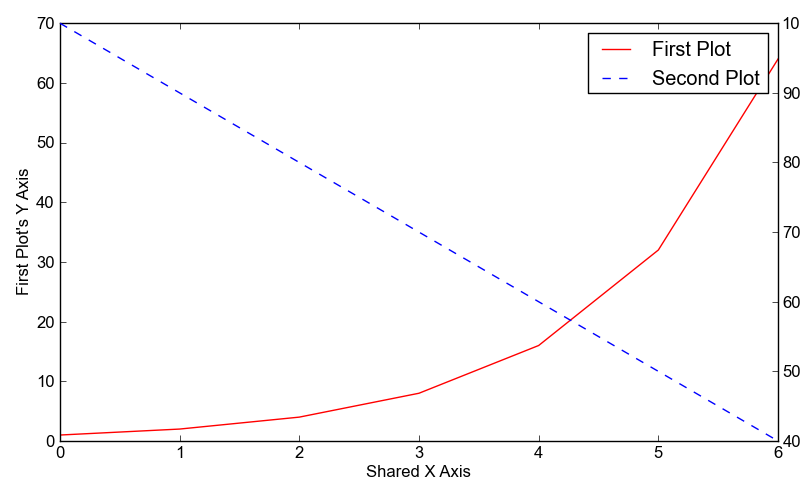
1 2 3 4 5 6 7 8 9 10 11 12 13 14 15 16 17 18 19 20 21 22 23 | line1 = Line()
line1.xValues = range(7)
line1.yValues = [1, 2, 4, 8, 16, 32, 64]
line1.label = "First Plot"
line1.lineStyle = "-"
line1.color = "red"
line2 = Line()
line2.xValues = range(7)
line2.yValues = [100, 90, 80, 70, 60, 50, 40]
line2.label = "Second Plot"
line2.lineStyle = "--"
line2.color = "blue"
plot = Plot()
plot.add(line1)
plot.add(line2)
plot.xLabel = "Shared X Axis"
plot.yLabel = "First Plot's Y Axis"
plot.setTwinX("Second Plot's Y Axis", 1)
plot.hasLegend()
plot.save("twinx.png")
|