Enter search terms or a module, class or function name.
Back to Examples
 1
 2
 3
 4
 5
 6
 7
 8
 9
10
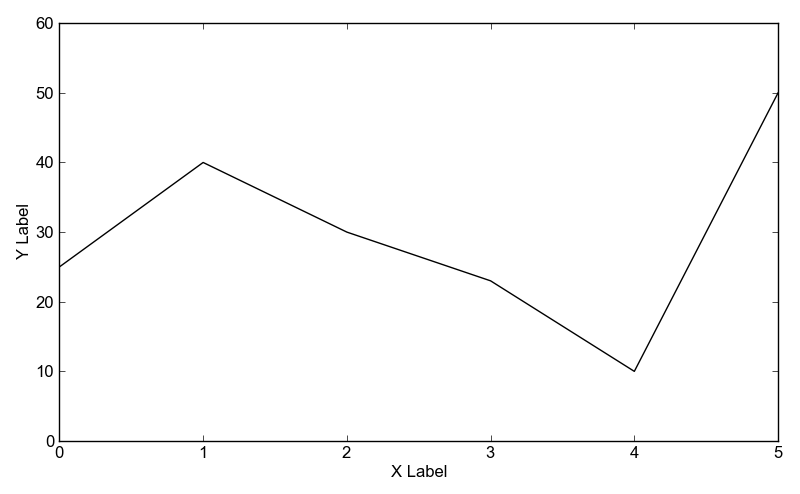
line = Line()
line.yValues = [25, 40, 30, 23, 10, 50]
line.xValues = range(len(line.yValues))

plot = Plot()
plot.add(line)
plot.xLabel = "X Label"
plot.yLabel = "Y Label"
plot.yLimits = (0, 60)
plot.save("simpleline.png")