Examples: examples/logscale.py
Back to Examples
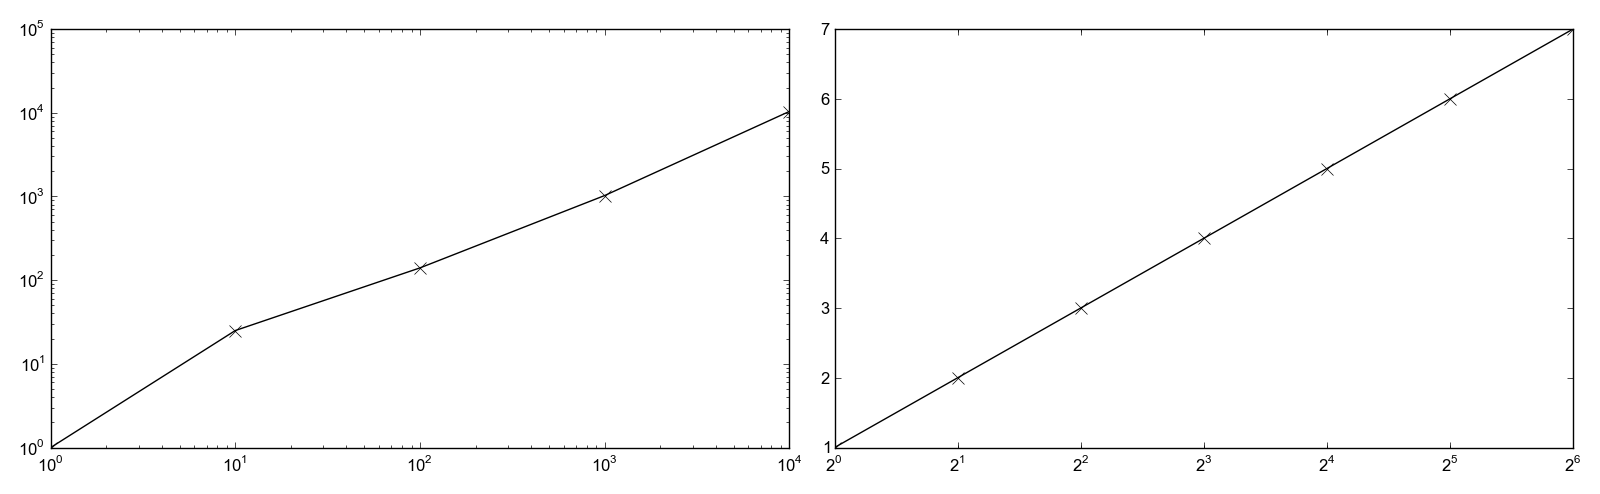
1 2 3 4 5 6 7 8 9 10 11 12 13 14 15 16 17 18 19 20 21 22 23 24 25 26 27 28 29 | layout = PlotLayout()
plotBase10 = Plot()
plotBase10.loglog = True
lineBase10 = Line()
lineBase10.marker = 'x'
lineBase10.xValues = [1, 10, 100, 1000, 10000]
lineBase10.yValues = [1, 25, 140, 1024, 10342]
plotBase10.add(lineBase10)
plotBase2 = Plot()
plotBase2.logx = True
plotBase2.logbase = 2
lineBase2 = Line()
lineBase2.marker = 'x'
lineBase2.xValues = [1, 2, 4, 8, 16, 32, 64]
lineBase2.yValues = [1, 2, 3, 4, 5, 6, 7]
plotBase2.add(lineBase2)
layout.addPlot(plotBase10)
layout.addPlot(plotBase2)
layout.width = 2
layout.save("logscale.png")
|