Examples: examples/latex.py
Back to Examples
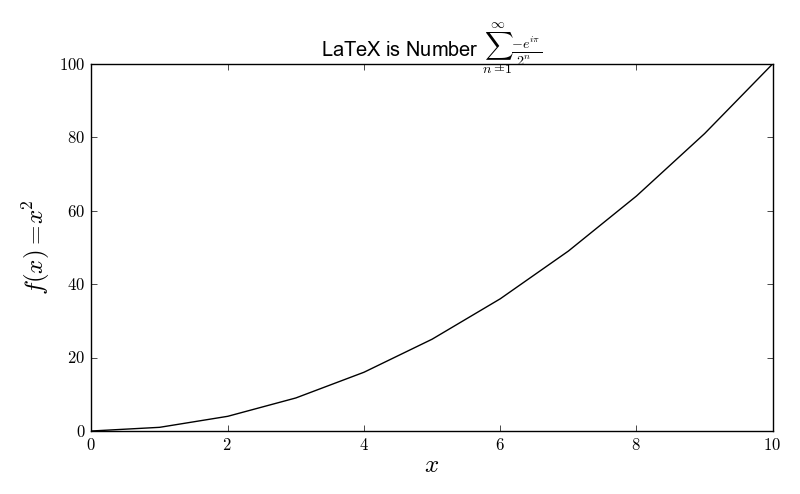
1 2 3 4 5 6 7 8 9 10 11 12 13 14 15 16 17 18 | line = Line()
line.xValues = [0, 1, 2, 3, 4, 5,
6, 7, 8, 9, 10]
line.yValues = [0, 1, 4, 9, 16, 25,
36, 49, 64, 81, 100]
plot = Plot()
plot.useLatexLabels()
plot.xLabel = r"$x$"
plot.yLabel = r"$f(x) = x^2$"
plot.title = (
r"LaTeX is Number $\sum_{n=1}^{\infty}"
"\frac{-e^{i\pi}}{2^n}$")
plot.add(line)
plot.tight = True
plot.axesLabelSize = 18
plot.save("latex.png")
|