Enter search terms or a module, class or function name.
Back to Examples
 1
 2
 3
 4
 5
 6
 7
 8
 9
10
11
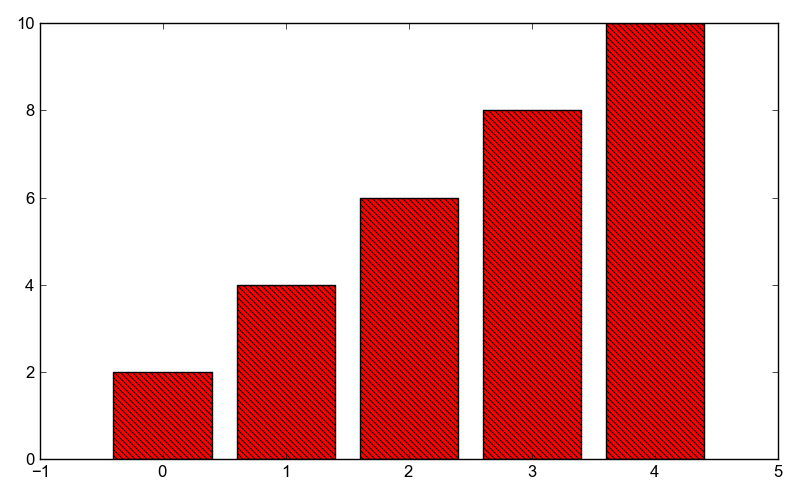
bar = Bar()

bar.xValues = range(5)
bar.yValues = [2, 4, 6, 8, 10]
bar.hatch = r"\\"
bar.color="red"
bar.edgeColor="black"

plot = Plot()
plot.add(bar)
plot.save("hatchedbars.png")