Examples: examples/customgrid.py
Back to Examples
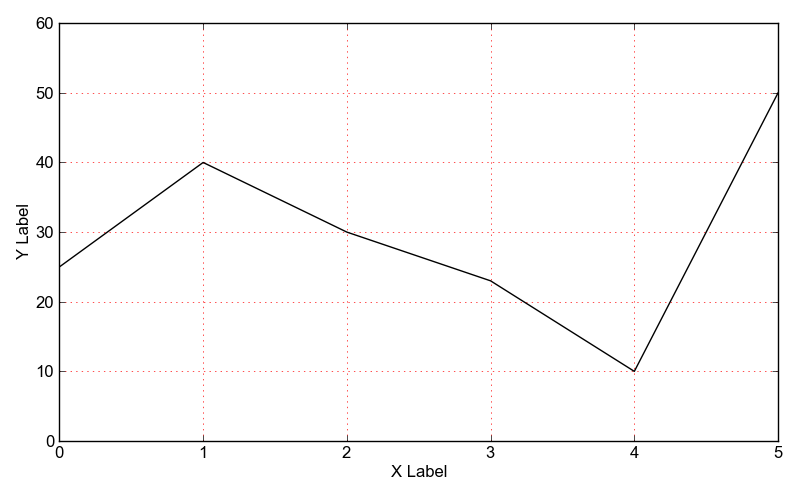
1 2 3 4 5 6 7 8 9 10 11 12 13 14 15 16 | plot = Plot()
line = Line()
line.yValues = [25, 40, 30, 23, 10, 50]
line.xValues = range(len(line.yValues))
plot.add(line)
plot.xLabel = "X Label"
plot.yLabel = "Y Label"
plot.yLimits = (0, 60)
plot.grid.color = "#ff0000"
plot.grid.style = "dotted"
plot.grid.visible = True
plot.save("customgri")
|